Définition
C’est l’agent préfet qui prend les décisions de restrictions d’irrigation. Les règles de prise de restrictions décrites ci-dessous sont celles utilisées sur la majorité du territoire français. Il existe cependant des règles de gestion différente, comme sur le périmètre élémentaire Adour amont.
Résolution
Spatiale
Il est calculé par le préfet sur les zones et secteurs administratifs.
Temporelle
Il est calculé tous les ans.
Interface entités
Les entités intervenant dans ce processus sont :
- Les stations de mesure (dont nodal)
- Les zones administratives
- Les secteurs administratifs
Description
Measures taken according to decision criteria
Once we approach the DOE threshold closely, measures in order to manage low water crisis must be put in place in order to assure the minimum regulatory water volume and both the drinking water supply and the agricultural needs at the moment.
Practically such measures consist of:
- a drought decree
- a water release, or
- a combination of both measures
In order to decide which measure to implement, there is a whole array of decision criteria that must be taken into account, and the decision is made case by case (for a detailed explanation of these decision-making process and the implementation made, see section Implementation and the diagram below.
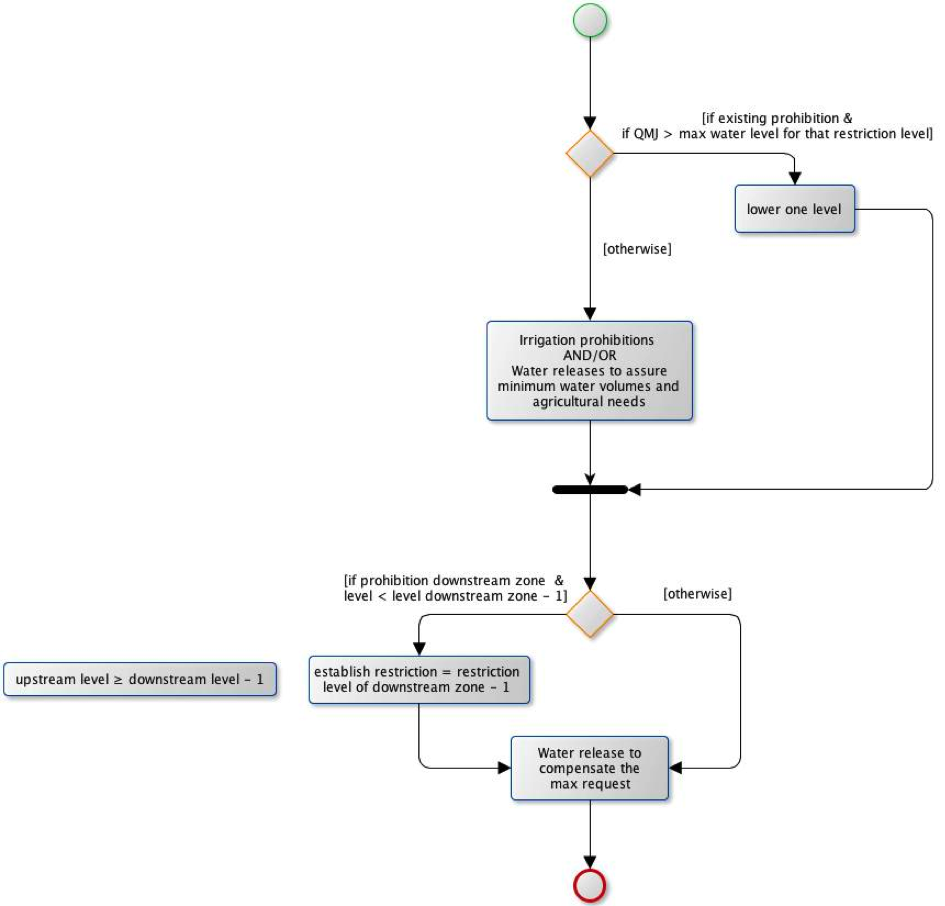
There is an obligation of both level progressivity and upstream-downstream solidarity. First, in case it is not the start of the drought campaign and measures have already been taken, if there is an ongoing irrigation prohibition and QMJ3 is higher that the maximum water volume for the restriction in place, then the restriction must be lowered one level. The levels and their hierarchy are detailed in the following diagram “Level progressivity”.

These conditions are designed for assuring the progressivity of restriction measures and the solidarity between the different zones along the basin. Concretely, it stipulates that “there should not be a difference of more that one [level] of restriction between two successive sections”. Therefore, in every zone there must be a restriction of at least one level less than the one imposed in each respective downstream zone.
Implementation
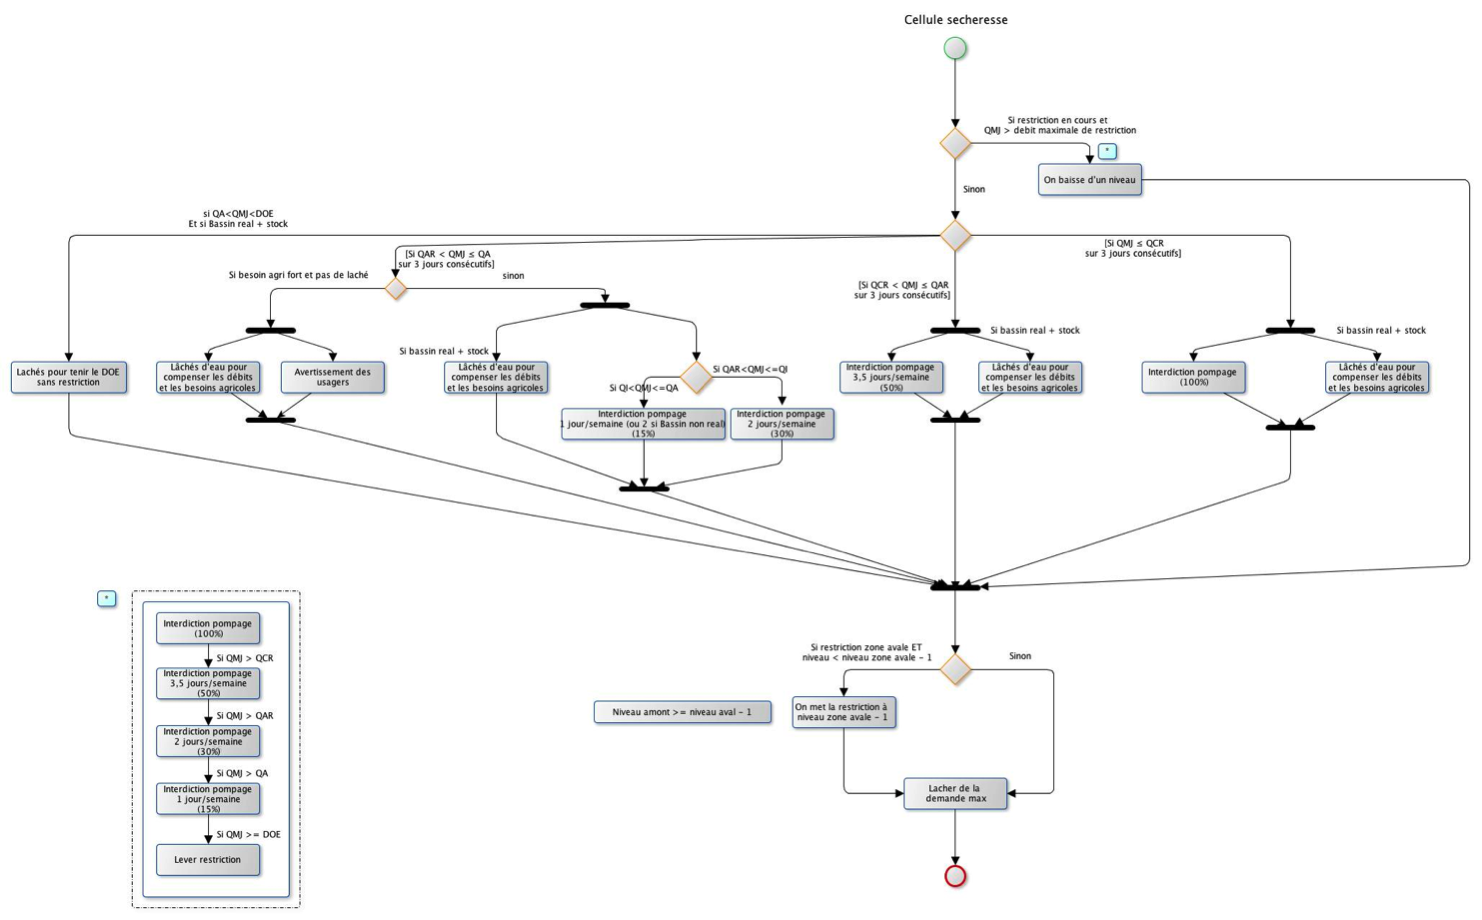
Diagrams 1 and 3 represent (schematically and in detail, respectively) the algorithm used to model low water crisis management. At each time step, if the observed water flow is less than the DOE threshold value, we apply the following :
- If no area has been restricted yet, we apply different protocols depending on the water flow:
- When the QMJ3 measured at the reference point is comprised between [QA, DOE], we make a water release in order to respect the DOE. This happens providing the area can be replenished (i.e. that there is available stock in the dam).
- When the QMJ3 measured at the reference point is comprised between [QAR, QA], two cases are possible:
- Either we request a water release, if we are in a zone that can be replenished and we are in a period of strong agricultural needs.
- Or we enact a drought decree prohibiting water withdrawals 1 or 2 days/week (depending if QMJ is higher or lower than QI).
- When the QMJ3 measured at the reference point is comprised between [QAR, QCR], an irrigation prohibition of 3 days/week is issued.
- When the QMJ3 measured at the reference point is lower than QCR, a total irrigation prohibition is issued (7 days/week).
- An important rule is that an upstream administrative area must always be a in restriction level greater or equal than the level of restriction of its downstream zone minus one.
- Once the restriction levels have been defined, the amount of water to be released from the dam must be chosen. We release a volume of water enough to compensate the maximum request.
- A last case to describe is the following: one where we enter the algorithm with administrative areas already under restrictions. If this is the case, we must check if the value of QMJ7 is higher than the maximum water flow corresponding to the restriction level in which the administrative area has been for the last 7 days. In this case, the restriction level is lowered one level.
Note :
- QMJ3 = average water flow over the last 3 days (in the Diagrams, please note that QMJ = QMJ3)
- QMJ7 = average water flow over the last 7 days.
Additional information regarding the implementation of the normative model
- We suppose that once a restriction is imposed, this restriction will be ongoing restriction for at least 7 days, i.e. it cannot be downgraded (level decreased) during that time.
- We suppose that an ongoing restriction cannot be upgraded for at least 3 days.
- For not replenished water streams, there is no available data regarding where they are controlled and when they are considered to be in a state of crisis. This verification is done visually, one by one, by ONEMA agents (ROCA system), hence there is simply no way to model such behavior.
Therefore, our solution is to treat these streams similarly to the replenished streams, by assigning them water flow threshold values (pre-calculated?). - In practical terms, the difference between the definition of “replenished water stream” and “not replenished water stream” is that the latter have no QA. If we consider that there are 3 levels of restriction:
Replenished WS NOT Replenished WS DOE — Level 1 QA Level 1 — QAR Level 2 Level 2 QCR Level 3 Level 3 Therefore, NOT replenished water streams will have DOE = QA because if the water flow is in the interval [DOE, QAR[ we will apply the same treatment.
- Regarding the water releases :
- It is necessary that stock available > 0.
- We suppose that it is not possible to make water releases before the 15th of August (due to Lac d’Oô convention, our only source of water reserves in the Garonne Amont zone).
- At every time step, we verify if there are ongoing restrictions that imply a water release. We make a water release to compensate the maximum request.
- At every time step, we verify if it is necessary to augment the volume of water released (i.e. if a zone is under a higher level restriction than the previous time step).
- If after 7 days, the water volume released remains constant (i.e. there are no further restrictions) we stop it.
- We do not take into account the analysis of the so-called “weather trend of the last 7 days”.
- We do not take into account weather forecast data.
Références
Mazzega, P., Therond, O., Debril, T., March, H., Sibertin-Blanc, C., Lardy, R., Sant’Ana, D. (2014). Critical Multi-Scale Governance Issues of the Integrated Modeling: Example of the Low-Water Management in the Adour-Garonne Basin (France). Journal of hydrology. DOI 10.1016/j.jhydrol.2014.09.043.
Mayor E., Sibertin-Blanc C., Thérond O., Panzoli D., Vavasseur M. and P. Mazzega (2012) Formal representation of Water Withdrawal Policies for Integrated Assessment. In : European Conference on Complex Systems, Brussels, 03/09/2012-07/09/2012, Gilbert Thomas, Nicolis Grégoire, (Eds.), http://hal.inria.fr/hal-00968234